
Treatment of Relapsed/Refractory Myeloma (excluding T-cell redirection therapy)
Category: Treatment of Relapsed/Refractory Myeloma (excluding T-cell redirection therapy)
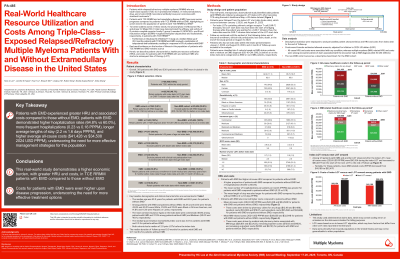
Real-world Healthcare Resource Utilization and Costs Among Triple-class–exposed (TCE) Relapsed/Refractory Multiple Myeloma (RRMM) Patients With and Without Extramedullary Disease in the United States

Hans C. Lee, MD
Director, Multiple Myeloma Research
Sarah Cannon Research Institute
Patients (pts) with RRMM who are TCE (exposed to ≥1 proteasome inhibitor, ≥1 immunomodulatory drug, and ≥1 anti-CD38 monoclonal antibody) have poor outcomes; those who also have extramedullary disease (EMD) have even worse prognoses. Real-world (RW) data in this population is scarce. This retrospective, observational study describes pt characteristics, healthcare resource utilization (HRU), and costs for TCE RRMM pts with and without EMD who started a subsequent line of therapy (LOT).
Methods: Adult RRMM pts with a subsequent LOT (index LOT) after they were TCE were identified from Komodo’s Healthcare Map (a US claims dataset). Pts were followed from the first LOT start date after TCE (index date; between Jan 1, 2020 and Aug 31, 2023) until the earliest of the following: end of insurance enrollment, last claim, death, or end of study period (Aug 31, 2024). Pts with ≥1 mo follow-up were included. EMD pts had an EMD diagnosis (Dx) before or at index. Non-EMD pts had no EMD Dx. Descriptive statistics were used for pt characteristics, HRU, and costs.
Results:
Overall, 278 EMD pts and 4,522 non-EMD pts were included (median follow-up, 10.4 and 12.8 mos, respectively). The median ages were 62 y for EMD pts and 65 y for non-EMD pts. Among EMD pts and non-EMD pts, 43.9% and 45.1% were female, 44.2% and 50.8% were White, 24.5% and 22.8% were Black, and 14.4% and 11.4% were Hispanic/Latino, respectively. The most common insurance types were commercial (47.8% EMD and 35.2% non-EMD) and Medicare (30.2% and 42.0%). Median Quan-Charlson Comorbidity Index values were 3.5 for EMD pts and 2.0 for non-EMD pts. Both cohorts had a median of 3 prior LOTs before index. A higher proportion of EMD pts vs non-EMD pts had ≥1 hospitalization (62.6% vs 58.0%); the mean number of hospitalizations per pt per mo (PPPM) was greater for EMD pts vs non EMD pts (0.22 vs 0.15). Mean length of stay was also longer for EMD pts vs non-EMD pts (2.1 vs 1.5 days PPPM). Mean all-cause costs (2024 USD PPPM) were $40,974 and $33,029 for EMD and non-EMD pts, respectively, driven by inpatient (IP) costs ($12,467 and $7,268), outpatient (OP) costs ($15,531 and $14,172), and pharmacy claims ($12,286 and $11,223). Mean multiple myeloma (MM)-related costs (PPPM) were $39,145 and $31,530 for EMD and non-EMD pts, respectively, driven by MM drug costs ($26,945 and $23,047), IP costs ($6,642 and $4,319), and OP costs ($5,068 and $3,891). Among 110 EMD pts with a subsequent LOT observed, overall mean-all cause costs (PPPM) increased from $43,586 during the index LOT to $54,055 from the start of the subsequent LOT to the end of follow-up; mean MM-related costs (PPPM) increased from $41,541 to $53,327.
Conclusions: This RW study demonstrates a higher economic burden, with greater HRU and costs, in TCE RRMM pts with EMD compared with those without EMD. Furthermore, costs for pts with EMD are even higher upon disease progression, underscoring the need for more effective treatment options.